Rent vs. Buy in 2026: How to Run the Numbers
With the Fed holding rates steady in June 2026 and its dot plot tilting away from cuts, here's the factual math behind renting versus buying — and a calculator to plug in your own numbers.

Written with AI assistance; every figure is checked against our calculators and primary sources, and reviewed by Ethan Ginsberg before publishing.
The bottom line
On a $400,000 home with 10% down at a 6.8% 30-year rate, the monthly principal and interest alone runs about $2,347 [C1].
Renting versus buying in 2026 comes down to one comparison: the full cost of owning (principal and interest, property tax, insurance, PMI, maintenance, closing costs, and lost growth on your down payment) against renting (rent, renters insurance, and what that down payment could earn invested). On a $400,000 home with 10% down at a 6.5% 30-year fixed rate, principal and interest alone runs about $2,275 a month.
A common rule of thumb puts the break-even horizon at roughly 5 to 7 years. Run your own figures at /tools/rent-vs-buy.
What changed at the June 2026 Fed meeting?
The Federal Open Market Committee (FOMC) held the federal funds rate steady at its meeting on June 17, 2026, according to the Federal Reserve's FOMC statement. The Committee also published its quarterly Summary of Economic Projections, the chart of rate forecasts known informally as the "dot plot." The federal funds rate is the overnight rate banks charge each other, and it is the rate the Fed actually sets.
Here is the part that trips up a lot of "wait for rates to drop" plans: the Fed does not set mortgage rates. The 30-year fixed mortgage rate tracks the yield on the 10-year Treasury note, which moves with bond-market expectations for inflation and growth, not directly with the funds rate. A change in the funds rate does not mechanically push 30-year rates in a single direction.
What is the 30-year mortgage rate right now?
Freddie Mac's Primary Mortgage Market Survey (PMMS), published weekly at freddiemac.com, is the standard reference for the average 30-year fixed rate. In mid-June 2026 it sat near 6.5% (the June 18, 2026 reading was 6.47%). That is the figure used in the examples below. Plug the current PMMS number into the calculator for your own math, because even a half-point swing changes the monthly payment materially.
What does owning actually cost each month?
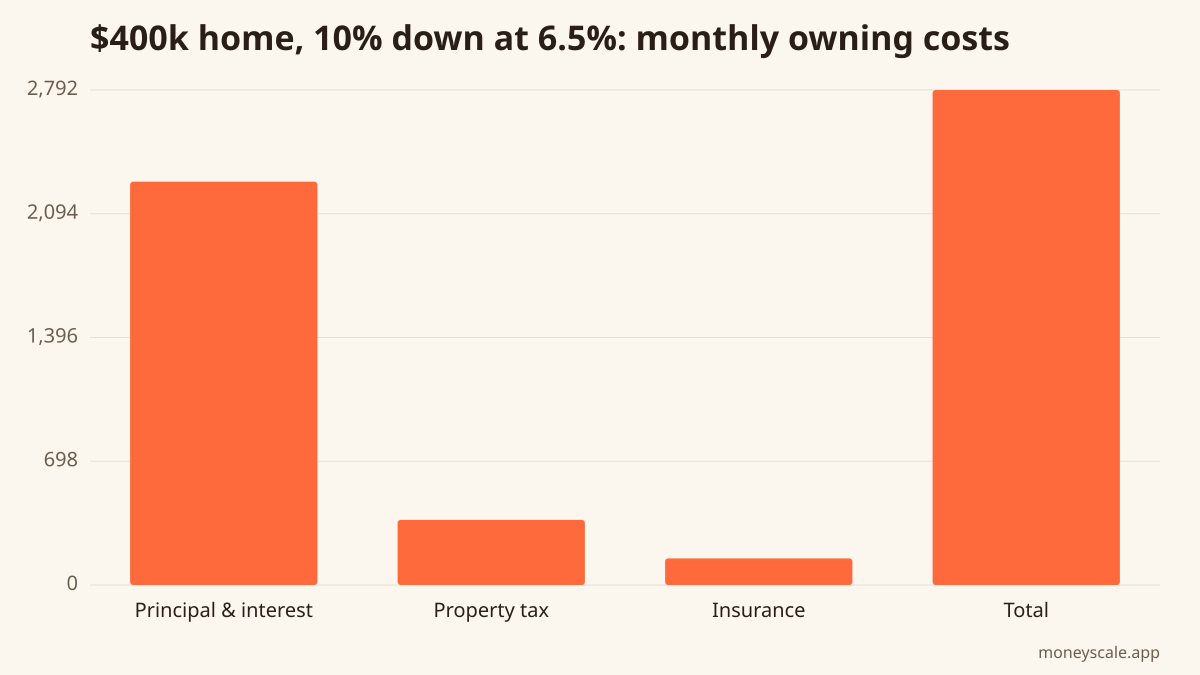
Owning is more than the loan payment. Here is the full stack on a $400,000 home, 10% down ($40,000), 6.5% rate, 30-year term, with property tax at 1.1% of value and $1,800-a-year insurance:
| Cost component | Monthly amount |
|---|---|
| Principal & interest | ~$2,275 |
| Property tax (1.1%) | ~$367 |
| Homeowners insurance | ~$150 |
| Subtotal | ~$2,792 |
That subtotal leaves out three real costs. Maintenance is commonly budgeted at roughly 1% of home value per year (about $4,000 here, or $333 a month). Closing costs are paid once, typically 2% to 5% of the loan, per the Consumer Financial Protection Bureau (CFPB). And PMI applies when the down payment is less than 20%.
How does PMI work, and when does it stop?
Private mortgage insurance (PMI) protects the lender, not the borrower, when a down payment is under 20%. The CFPB (consumerfinance.gov) lays out the thresholds: a borrower can request PMI cancellation once the loan balance reaches 80% of the home's original value, and under the federal Homeowners Protection Act the lender must automatically terminate it when the balance hits 78% of original value, assuming payments are current. PMI typically costs a few tenths of a percent of the loan per year. At 10% down on a $400,000 home, that is often $100 to $200 a month until the equity threshold is crossed.
What does renting cost, and what about the down payment?
Renting has its own running costs: rent, renters insurance, and the opportunity cost of not having the down payment invested. The shelter component of the Consumer Price Index, tracked by the Bureau of Labor Statistics (BLS) at bls.gov, has kept rising in 2026, though more slowly than during the 2022–2023 spike. Shelter is one of the largest weights in CPI, so the rent line in any comparison is a moving target.
The down payment is the hidden variable. Renting and investing that $40,000 instead, at a 5% average annual return, would grow to about $56,721 over 7 years, roughly $16,721 of growth. That foregone growth is a real cost of buying, and it belongs in the comparison. (Five percent is an illustration, not a forecast; markets do not return a fixed number.)
What is the break-even horizon for buying?
Buying carries large up-front costs, including closing costs and the spread between buying and selling fees, that are only recovered by staying put long enough. The break-even point is the number of years at which the total cost of owning drops below the total cost of renting the same place. A widely cited rule of thumb is 5 to 7 years, but the actual number depends on local rent, the rate locked in, home-price changes, and length of stay. There is no single right answer, only the inputs.
How do you run your own rent vs buy numbers?
Use the rent-vs-buy calculator. Enter local rent, the home price under consideration, the current Freddie Mac rate, the down payment, the property-tax rate, and the expected length of stay. The math, not a forecast about where rates go next, is what reveals the break-even year for a given situation.
Definitions in plain English
- Federal funds rate: the overnight rate the Fed sets for banks; not the same as a mortgage rate.
- Dot plot: the FOMC's chart of where each member expects rates to go.
- PMI: insurance that protects the lender when a down payment is under 20%.
- Break-even horizon: the year owning becomes cheaper than renting, given the inputs.
Run your numbers
Plug your own figures into the Rent vs Buy calculator and see your specific outcome.
Open Rent vs BuySources
Related reads
Accredited Investor Rules (2026): Who Can Buy Private Companies
The 'accredited investor' rule is the legal gate that decides who can buy into private companies like SpaceX, OpenAI, and Anthropic. Here are the exact income and net-worth thresholds, the credential exceptions, and why the rule exists.
Read itCan You Buy SpaceX Stock? What 'Pre-IPO' Really Means (2026)
For years you could not buy SpaceX stock at all — it was a private company. In 2026 that changed when SpaceX filed to go public. Here's the honest, up-to-date picture: what 'pre-IPO' meant, how employee share sales worked, and what its IPO filing actually says.
Read itFederal Student Loan Interest Rates for 2026–27: How the July 1 Rate Is Set
The new fixed rates for federal Direct loans disbursed July 1, 2026–June 30, 2027, the Treasury-plus-add-on formula that sets them, and how one rate point changes a payment.
Read itHow Money Market Fund Yields Work After the June 2026 Fed Meeting
A plain-English look at what a money market fund is, how its yield tracks the federal funds rate, and why those yields stayed near current levels after the Fed held rates on June 17, 2026.
Read it
Money Scale Weekly
Read another one like this on Thursday?
We send one short, sourced money read per week. Tied to rent vs buy and the other Money Scale pillars. Free, no spam, one click to unsubscribe.
Drop your email and you're in. We send one short read on Thursday — and nothing else without your asking.